The Value of Horses’ Performance: Course, Distance, and C&D Winners Compared

Course winners, distance winners, course & distance winners in flat racing

I looked at course, distance, and course and distance National Hunt data a few months back, writes Dave Renham. I will revisit this area now but switch my attention to the flat. I will ignore all-weather racing to write about that in the future. Hence, these findings apply only to UK turf flat racing, and I have looked at the last eight full seasons from 2016 to 2023.

I mentioned last time that there is a perception that course form is necessary; likewise, some see it as a positive if the horse is proven over the distance. In the National Hunt article, previous course winners/distance winners/C&D winners won more often than horses that had not won at the course/distance/C&D. They offered slightly better value despite the market adjusting quite well. Let us see if we see a similar pattern ‘on the level.’

[ez-toc]

Course winners: I am starting with course winners. As we know, courses in the UK are not uniform – the topography for each course varies. Hence, one would assume some horses act better on specific courses than others. I would like to begin by comparing the strike rates of course winners versus horses that have not won at the course (non-course winners). Both win and each way figures are shown: Course winners clearly do better from a win and a win-and-placed perspective.

Regarding returns to SP, course winners do slightly better, although the difference between the two is barely 2p in the £. To Betfair SP, the roles are reversed, with non-course winners doing a little better. As we have seen in various past scenarios, the betting market seems good at making the necessary adjustments.

Looking at the non-course winner group first, if we split them into two as follows:

1 -  those who have previously run the course

and

2 -  those who have not run the course previously,

then we see that those who have not run the course have been slightly more successful in terms of win percentage – 11.3% strike rate compared to 9.9%. In terms of returns, however, they are virtually identical.

One stat worth sharing is that horses with no course wins who have raced 15 or more times at the track in question have won just one race from 81 attempts. Such horses are rare, but it looks like any future qualifier we can put a line through.

Concentrating now on course winners, I would like to start by looking at horses with just one previous course win to their name. 

Course Wins = 1

I will split their performances by the number of runs they have had at the track. The reason behind this is simple: you could get some horses that have raced once at the course and hence are one from one, whereas you could get horses that are one from 10 or even one from 20. A horse that has just won once in 20 attempts at the same venue will not scream out as a horse that is particularly suited to the course.

Let me share the win strike rates for different numbers of course run groupings:
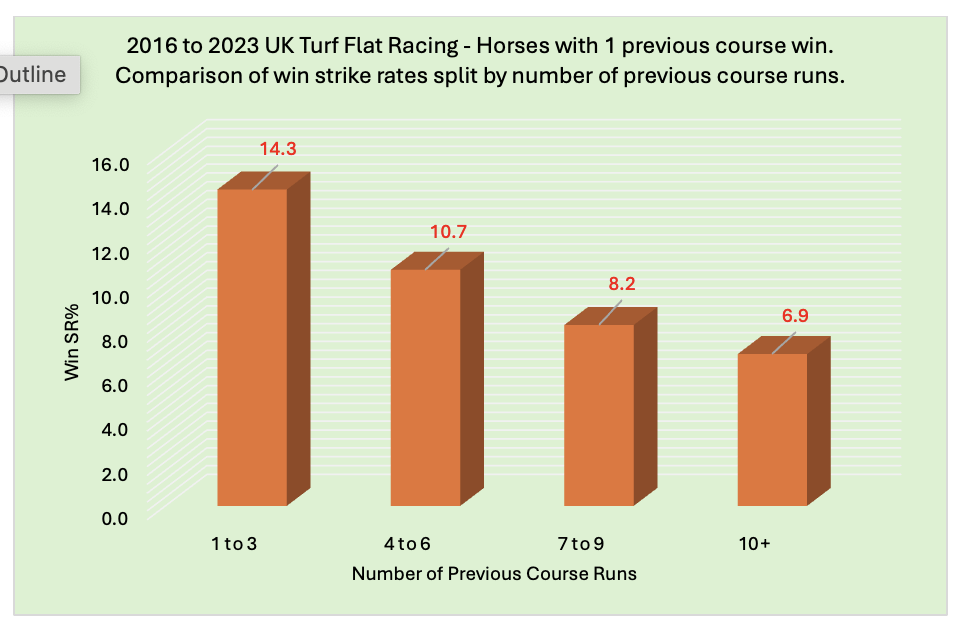
The graph clearly shows that one-time course winners with fewer previous course runs win more often. Horses that have won once at the track but raced there 10 or more times have scored less than once in every 14 attempts.  

Let me see if the A/E indices correlate with these strike rates:
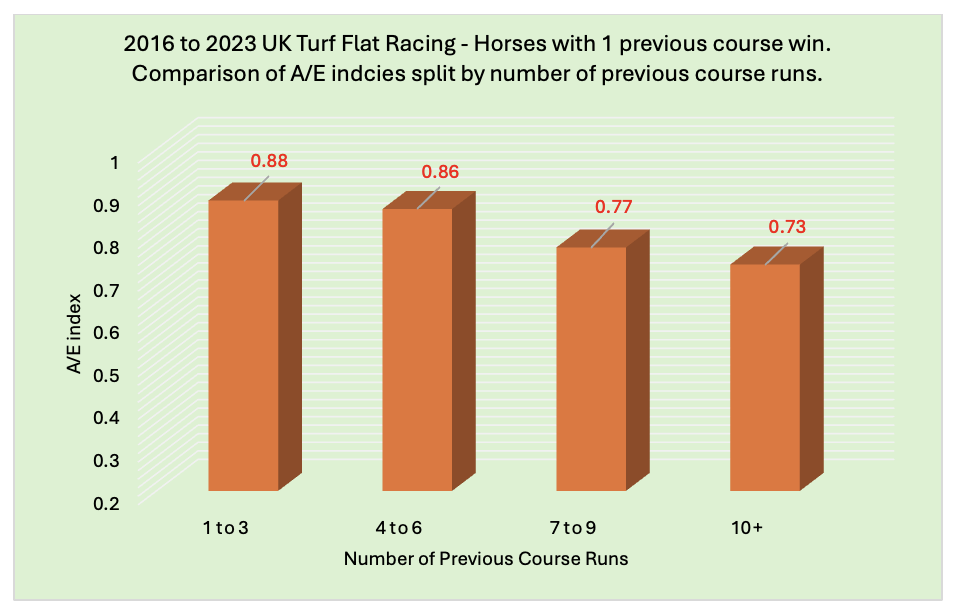
The graph shows a strong relationship between the A/E indices and the strike rates. Any potential value in one-time course winners tails off once we hit seven or more previous course runs.

Course Wins = 2

I will look at the same idea for horses that have won twice previously at the course. Once again, I’ll start with the win strike rates for different numbers of course run groupings:

We see the same pattern as before. It should also be noted that horses with two-course wins who had previously raced at the course either twice or thrice broke even to BSP (ROI was –0.4%). 

Onto the A/E indices now: The two to three previous course run group has a very solid A/E index at 0.92. The 10+ group spoils the correlation, but if we look at the complete stats, we can clearly see that the returns to BSP indicate that the fewer previous course runs, the better.
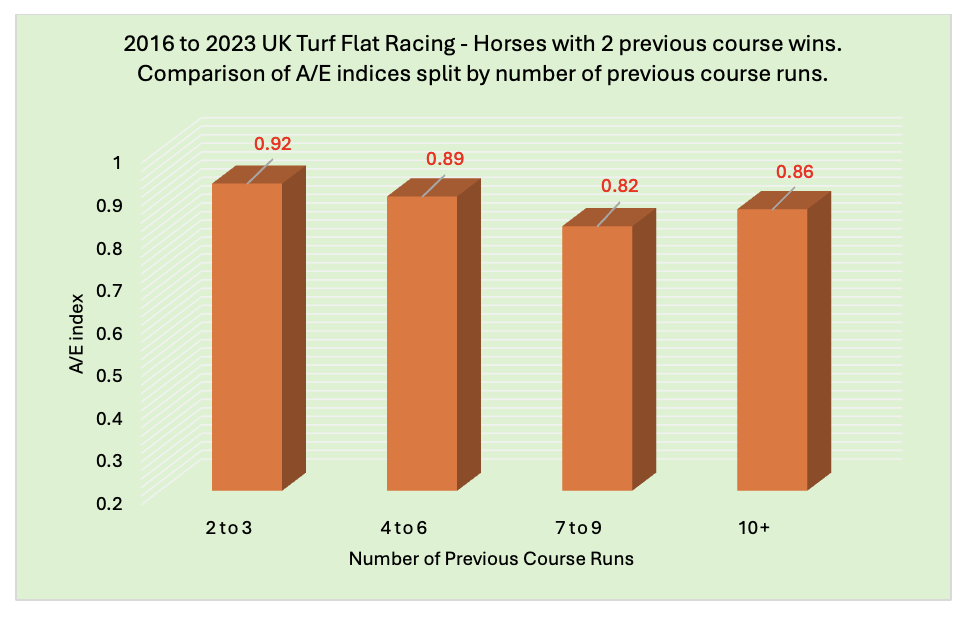
Losses become significant once we get to seven or more previous course runs.


Course Wins = 3+

I will now lump together horses with three or more course wins to give us a decent sample size. This time though, as we have different numbers of previous course wins, it makes sense to share the data using past course win percentages. Hence, a horse with three wins from 5 visits would sit at 60%, a horse with four wins from 25 would sit at 16%, and so on. This time I will go straight to a table showing all key stats in one area:

Horses who have previously won at least two-thirds of their starts at a particular coursethe 67 to 100% grouphave by far the best overall figures. They have a much higher strike rate and the best A/E index and have made a small profit to BSP. 


We have seen the same pattern across all data sets to date: horses with the best course win rates (based on all previous course runs) perform the best.


Before moving on to distance winners, I want to examine the results for individual courses. To do this, I will look at the A/E indices for horses that have won at least once in the relevant course. Here are the courses with the ten highest A/E indices.


*I am using A/E indices regularly in this piece and if you would like to read more about A/E use link -www.geegeez.co.uk/horse-racing-metrics-a-e-iv-prb/

Haydock and Epsom have particularly strong indices. Epsom is a very unique track, and it will come as no surprise to many that it appears so high on the list. Two courses that have not made the cut, which I thought would, are Brighton and Chester. They were joint 14th on the list with an A/E index of 0.87.

Three courses have recorded an A/E index of under 0.80: Yarmouth (0.77), Thirsk (0.75), and Carlisle (0.75). Wetherby also has a figure under 0.80 at 0.71, but the data set is too small to be confident in. 

Distance winners: It is time to switch my attention to distance winners. As with course winners, I will start by comparing the strike rates of distance winners versus horses that have not won at a distance (non-distance winners). Both win and each way figures are shown once more:
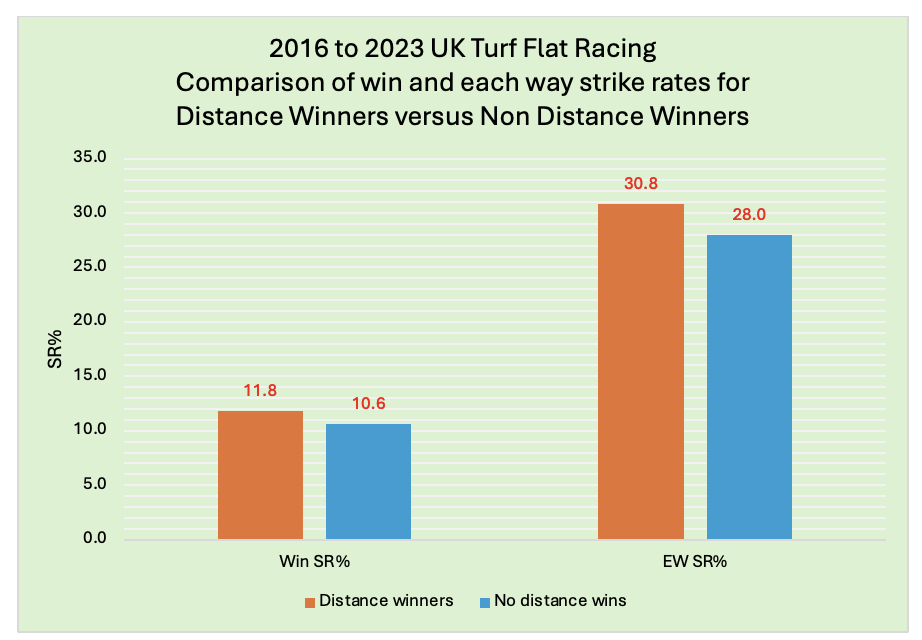
There is a slight edge to distance winners, but they have virtually identical A/E indices at 0.87 and 0.86, respectively. When looking ‘generally,’ winning previously at a distance does not offer much of an edge in turf flat racing. However, it is always worth digging a little bit deeper.

Let me compare past distance win percentages by grouping all past distance winners. Here are the findings:

Horses who have previously won at least two-thirds of their starts at a particular distance have done best. A very solid-looking A/E index of 0.92 with losses of 2p in the £. This shows a similar pattern to when we combined the 3+ course win data earlier, especially when considering that top group.

Next, I decided to examine whether it makes a difference how recent that last distance win was. This is what the stats told me:

Unfortunately, this data offers little, with the only discernible ‘general’ pattern being that the more recent the win, the more likely a horse is to repeat that win. 


After further digging, I discovered the most interesting findings concerning distance winners.

1. Looking at older horses aged 5+, if you restrict this cohort to having won once at a distance on their only start at that distance, they have proved profitable to follow. Hence, if backing ALL 5yos and older with one distance win from one distance start when having their second start at the relevant distance, you would have won 133 races from 862 qualifiers (SR 15.4%) for a BSP profit of £220.34 (ROI +25.6%). These runners have an A/E index of 1.01 and have been profitable for the past five years.  

2. Horses with three wins from three starts at the same distance have proved profitable to follow when they have attempted to make it four distance wins out of four. They have won over 28% of the time (53 wins from 188) for a BSP profit of £62.52 (ROI +33.3%). The A/E index stands at an impressive 1.13.

3. Horses aged nine or older that have achieved two distance wins in their careers have proved to be poor investments, regardless of how many distance runs they have had. This group has provided 921 runners, of which only 56 won, hitting a win percentage of just 6.1%. Backing all qualifiers to £1 level stakes would have lost you £216.64, which equates to over 23 pence in the £. 

4. Two-year-olds with two or more distance wins have made a profit when attempting the distance again. They have 144 wins from 891 (SR 16.2%) for a BSP profit of £38.23 (ROI +4.3%).

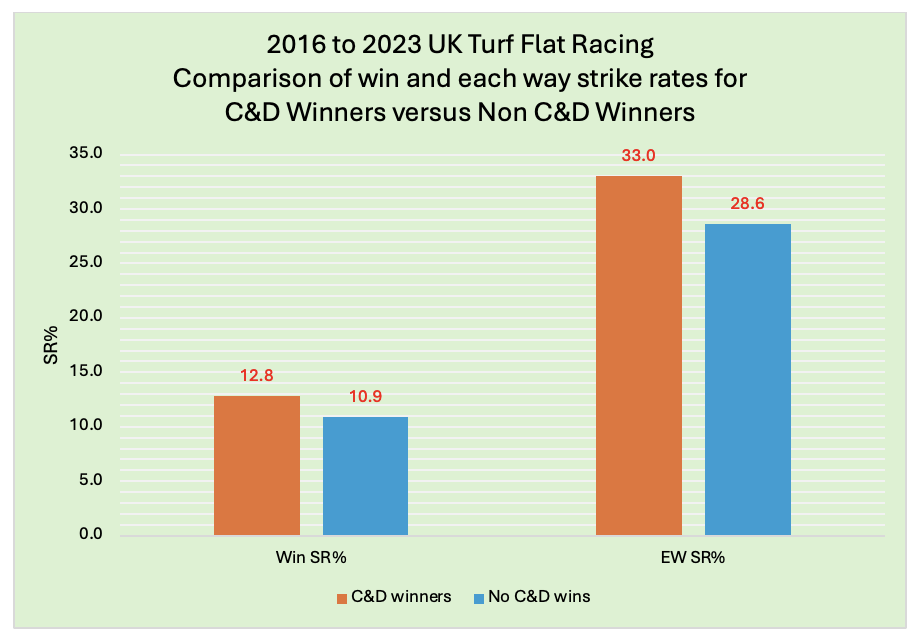
Course and distance (C&D) winners: It is now time to combine the two. I will start by comparing the strike rates of C&D winners versus horses that have not won over C&D (non-C&D winners). Both win and each way figures are shown once more:

These are the highest win percentages we have seen for the ‘winning’ group to date, but only just. The returns to SP have been virtually identical, with a wafer-thin edge to C&D winners, but to BSP, non-C&D winners have proved better value by nearly 6p in the £ (4% loss compared with 10% loss). 

Onto the win strike rate in terms of the number of C&D wins. Here are the splits:

The results for 4+ C&D winners are the reverse of the National Hunt findings. In NH races, horses that had won 4 or more times over course and distance scored 15.5% of the time, procuring a healthy return of over 41p in the £. On the flat, this group scored less than 10% of the time, losing over 34p in the £. 


It is past C&D win percentages I want to look at next. I am using the same percentage bands/groupings as before:

We see the usual trend of the strike rates dropping as the C&D win percentages drop. Once again, the best overall stats are the group with the highest C&D Win% of 67% or more. It is possible that some value bets could be found within this group.


Individual course C&D data is the next port of call. Courses are listed alphabetically with ‘positive’ A/E indices (0.93 and above) shown in green and ‘negative’ indices (0.80 or lower) shown in blue. Profit/losses have been calculated to BSP less 5% commission:

Just two of the six ‘green’ courses (Chester and Newbury) managed a blind profit to BSP. Generally, though, the takeaway should be to avoid C&D winners from the courses in blue, especially Carlisle, Thirsk, Windsor, and York.

Finally, I want to share the trainers who have performed best with past C&D winners when comparing their performance to their non-C&D winners. Seven trainers are listed in the table below, comparing their win percentages for the two respective groups:

These seven all perform above the norm when it comes to past C&D winners. Five of the seven have produced blind profits to BSP with their C&D winners, with six hitting A/E indices of 1.00 or bigger. Here are the individual figures for these past C&D winners:

There are some solid stats there. It will be interesting to see how these trainers fare in the next few years with their past C&D winners.

-------

To conclude, previous course winners/distance winners/C&D winners definitely win more often than horses that have not won at the course/distance/C&D. However, evaluating the better value is more complicated. Generally, course/course and distance winners give better results than distance winners.

I will leave you with what I feel are the most interesting findings:

1. Horses who have won once or twice previously at the course, stick to those horses that have raced six or fewer times at the venue.

2. Horses that have won 3 or more times at the course, stick to horses that have won at least two-thirds of their races (67%+).

3. Past winners returning to either Haydock, Epsom, or Ripon, I would take as a positive.

4. Horses that have won at least two-thirds of their races (67%+) at a distance are the best distance group to concentrate on (losses of only 2p in the £).

5. Avoid horses that have won four or more times over C&D.

6. Chester and Newbury are courses where C&D winners generally perform above the norm.

7. Be very wary of past C&D winners at Carlisle, Thirsk, Windsor, or York.

8. The stables of Mick and David Easterby, Charles Hills, Brian Ellison, Mick Appleby, Iain Jardine, Bryan Smart, and Ed Walker have done well with their C&D winners.

Dave Renham: Chester Draw & Pace Part 1

This is the third in my series of articles on draw and pace bias at UK courses, writes Dave Renham. Pontefract and York were the first two to come under the spotlight, and now it is the turn of arguably the most draw biased track in the country, Chester.

Chester is by all accounts a lovely place to go and watch racing and, as I write this piece entering the fourth week of lockdown due to the coronavirus, the Roodee is a course that I will make every effort to visit in the future. It lies close to the River Dee and is officially the oldest racecourse in the world, dating back to 1539.

Chester Racecourse is a very tight track only just over a mile in circumference, which means that it does not suit long striding horses because the runners are so frequently on a left-hand lean. The home straight is only 240 yards in length - barely more than a furlong - which tends to help horses close to or on the pace. Traditionally, lower drawn horses near to the inside rail have had a decent edge at most distances. This bias is well understood across the racing fraternity, though, so whether we can actually get a worthwhile betting edge constitutes the purpose of what follows.


Chester Racecourse Map

Chester Racecourse Map


As with the last two articles, I am using some of the tools available on the Geegeez website: Draw Analyser, Pace Analyser and the Query Tool. The main period of study is a long one, going back to 2009, but I will also examine a more recent (2015 to 2019) data set in detail where appropriate. I will be focusing once again on 8+ runner handicap races only and looking exclusively at the distances from 5f to 7f.

When looking at each race I will be dividing the draw into three equal sections (low, middle, high). This is how the Geegeez Draw Analyser does it and has been the way I have generally done it for 25 years. Draw positions are also adjusted when there are non runners to make the data as accurate as possible. For a strong draw bias I am looking for a figure of over 50% for one ‘third’ of the draw, and I am looking for this starting point to ideally correlate with other metrics such as A/E values.


Chester 5 furlongs (8+ runner handicaps)

Since 2009 there have been 86 races that have qualified. I have also included races over five and a half furlongs, of which there of which there were 29. Here are the overall draw splits:

As can be seen, very strong bias exists which has been consistent year in year out. Below I have split out the 5f data and 5½f data for interest:

The low draw figures mirror each other, but the middle and top thirds seem to ‘reverse’. Possible reasons could be that high draws really don’t have enough time to recover over 5f, whereas the extra half furlong gives them more of an opportunity to get back into it. It could be that middle draws get ‘squeezed' somehow over 5½f. Of course it could perfectly conceivably be down to random results as there were only 29 races in total for the 5½f stats.

Onto A/E values now (5 and 5½f races) and low draws have actually offered value over the longer term:

In terms of breakdown, the five-furlong races produced a low draw A/E value of 1.05, whereas races over 5½f had a slightly better value of 1.14.

It is time now to look at each draw position broken down by individual stall number (5f and 5½f):

As we can see, stalls 2, 3 and 4 have all made a blind profit to SP, and stalls 1 to 4 have provided 63 of the 86 winners which equates to 73.3% of all races. Horses drawn 11 or wider have provided just two winners from 74 runners with only three others getting placed. The huge advantage to low draws is clear.

We can consider that macro picture in context by looking at a more recent data set covering the past five seasons (2015-2019). Here are the draw splits for this shorter time frame (total races 42):

Low draws have been consistently winning at greater than the 60% mark so on the face of it the bias seems as strong as ever. For those who like exotic bets, doing a reverse forecast on the two lowest drawn horses would have netted you an amazing ten winning bets in 42 races. Now the dividends varied greatly as they are dependent on the prices of the horses that fill the first two places. Three of the dividends paid under £10, but two paid between £50 and £70. If you had placed a £1 reverse forecast on all 42 races going back to 2015 you would have been in profit by an impressive £182.41. For any tricast punters out there, if you had permed the three lowest draws in 6 x £1 full cover tricasts, you would have won 4 times and netted a profit of £189.85. I cannot guarantee such returns in the future but it is certainly food for thought.

Here are the 5 year stats for individual draw positions:

In this shorter snapshot, 71.4% of all races have been won by horses drawn 1 to 4, which correlates with the 11 year figure of 73.3%.

Despite everything looking very rosy still for low drawn horses and amazingly still producing some profitable angles I do have a word of caution: I think there are signs that the bias is getting less strong, more notably in the past two seasons. If you look very closely at the 2018-2019 results as a whole, the low draw bias seems less pronounced. Now there have only been 15 races during these two seasons so it could simply be an anomaly due to an extremely small sample.

However, there is a reason why I think this might be the case rather than simply hypothesising over a set of numbers. In the last two seasons 12 of the 15 qualifying races (80%) have been run with the inside rail having been moved. This is almost certainly an attempt by the course to try and nullify the bias as best they can – indeed rail movement has risen from 22% in 2016 to 50% in 2017 to this new figure of 80% during the past two seasons. The rail movement is also not consistent from meeting to meeting having moved different distances ranging from a minimum of 10 yards to a maximum of 33 yards.

Digging deeper into these very recent results, in the three races when the rail was not moved in 2018/19 all three races were won by low drawn horses – in fact both 1st and 2nd were filled every time by horses drawn either 1, 2 or 3. In the 12 races where the rail was moved, less than half of the races (five) were won by the bottom third of the draw and generally the races looked far more even when looking at placed positions too. As mentioned above, the data set is far too small to be anywhere near confident, but it will be interesting to see if this emerging pattern continues in the near future.

Let us consider pace and running styles now. For the pace section I am going to study just the overall figures (2009-19):

A significant edge has been to front runners which win roughly three races in every ten while, in contrast, hold up horses are at a huge disadvantage here. That is almost solely due to the tight turning nature of the track, especially at this trip, coupled with the very short straight. Hold up horses just haven’t got enough time to pass the many runners that would be in front of them as they straighten up for home. The figures are very similar for both the 5f distance and the extended 5 furlongs (5½f). Front runners also produce an impressive A/E value of 1.84.

In terms of whether the going makes a difference, the figures are fairly even across the board although on good ground (34 races) the win percentage for front runners edges up to just over 34% with an IV of 3.79. I don’t personally believe the front running bias is stronger on good ground – the place data is no stronger for example - but I felt it was worth mentioning.

In terms of field size and the number of runners, the front running bias seems strong across the board; it is possibly slightly stronger in smaller fields but when you split the data up some of the sample sizes are a little small to confidently make that inference.

Now a look at draw / pace (running style) combinations for front runners in these 5f races. Remember this is looking at which third of the draw is responsible for the early leader of the race (in % terms):

As one would expect, the early leader comes from lower draws more than half of the time; it is clearly difficult to lead early from a wide draw which makes perfect sense given the appeal of such a position and the topology of the course. It is also easier to win having led early from a low draw rather than from a middle or high draw. Low drawn early leaders have gone onto win 37.2% of their races (23 wins from 61) – an impressive stat.

Having said that the figures are still solid from middle and higher draws: middle draws have won eight times from 35 (SR 22.9%) when leading early, and high draws have won four from 14 (SR 28.6%). Digging deeper, horses that take the early lead from stalls 1 and 2 do lead more often than any other draw and go on to win around 40% of the time.

Below is the draw/run style heat map, displaying place strike rate, for 8+ runner five- or five-and-a-half furlong Chester handicaps since 2009:

The summary is that the combination of a low draw coupled with good early pace, or at least the ability to lead, is extremely important at Chester over 5f.


Chester 6 furlongs (8+ runner handicaps) 

The 6f distance is run less regularly than the 5f / 5½f one, with 66 qualifying races going back to 2009. Here are the overall draw splits:


The strong low bias seen at 5f does not occur in the same way here with middle draws being almost as successful as low draws. What is clear however, is that there continues to be a strong bias AGAINST high draws. The A/E values illustrate that middle draws have definitely been the value:


A look again at individual draw positions and how they have fared over this time frame:


Although the lowest third of the draw did not totally dominate the win percentages, draws 1 and 2 have been very successful in terms of wins: 25 wins out of the 66 races equates to just under 38% of all races won by the two lowest boxes. Both have made a blind profit – draw 1 having performed particularly well. It should be noted, not unexpectedly of course, that double figure draws have provided just one winner from 118 runners!

Looking at ground conditions it is possible that firmer ground accentuates the bias against higher draws a little, which seems logical also. On good ground or firmer the top third of the draw have won just 4 races from 38; on good to firm or firmer they have won 0 from 12 races with only 5 horses placing. Limited data, yes, but something to bear in mind I feel.

Onto the last five seasons now. Although there have been only 30 qualifying races since 2015, I believe it is still worth sharing the draw splits:

High draws have continued to struggle in the more recent past, while middle draws have performed slightly better, and the centre is where the value seems to be once again. Double figure draws have secured zero wins and just four places from 46 runners. For A/E values I am going to split the data by draws 1 to 4, then 5 to 8 and finally 9 or higher:

Again, it appears that draws 5 to 8 have been the value stalls in the past five seasons.

Let's break down the individual draw figures for the last five seasons, 2015 to 2019:

With only 30 races in the past five seasons the individual stall data is rather limited and I personally would not read too much into it. Stall 1 has performed well as one might expect in the context of the 11 year data shared earlier.

Below are the running style figures for 6f 8+ runner handicaps at Chester, going back to 2009:

These figures show that front runners have a decent edge while horses that track the pace also perform above the expected ‘norm’. Horses that race mid pack or at the back early are at a clear disadvantage for the same reason that they are over 5f: the short straight makes it very difficult to win when coming from off the pace. Horses held up in the back are worse off than horses that race mid-division.

This pace bias AGAINST hold up horses strengthens as the field size increases. The table below looks at the 11 year splits for the 32 six-furlong handicap races with 11 or more runners:

As can be seen, there were no wins at all for hold up horses, whereas 26 of the 32 races were won by horses that raced close to or up with the early pace. The majority of races (18 of 32) were won by prominent runners, though there were, naturally, more prominent races than race leaders and their peer group strike rates are very similar.

Now a look at draw / pace (running style) combinations for front runners in 6f handicaps (2009 – 2019):

Over 60% of the races have seen the early leader come from the bottom third of the draw (low), a percentage that is even higher than the 5f data. This is a very high figure and worth noting.

The 6f trip does not give low draws the edge, however, as it does over 5f. Rather, only the two lowest stalls as noted earlier have managed to win consistently more than might be expected, taking roughly 38% of all races.

Horses drawn 10 or higher have had little or no chance of winning throughout the eleven-year sample period.

Pace wise, early leaders and prominent runners are clearly most favoured.

The graph (sorted by IV3, the average Impace Value of a stall and its immediate neighbours) and heat map (displaying A/E) below both illustrate this:


Chester 7 furlongs (8+ runner handicaps)

There are two 7f distances at Chester, one over 7f and the other over 7½ furlongs. In this article I am going to look solely at the shorter distance of the two. I plan to look at the extended 7f trip in a subsequent 'Part 2' article. Since 2009, over 7f there have 75 qualifying races.

Low draws have had a strong edge having been responsible for just over half the winners. The A/E values look like this:

The market definitely factors in the advantage that lower draws generally have here, an A/E figure of 0.94 implying that there is a slight negative expectation from backing such runners. Having said that there may still be some value in backing selected lower drawn runners.

Let us now look at each individual draw and its associated stats since 2009:

36 of the 75 races were won by one of the three lowest stalls, but only draw 1 has shown a blind profit during the long period of study.

When checking the data for specific ground conditions the stats suggest that on softer ground the low draw bias increases. On good to soft or softer there have been 37 races of which 22 (SR 59.5%) have been won from the bottom third of the draw (low). The A/E value nudges up to 1.09, and backing all low drawn horses would have secured a small profit to £6 to £1 level stakes at SP.

Time now to switch attention to more recent results and the past five seasons. Here are the draw splits for 2015 to 2019 (total races 33):

The bias has been similar in this shorter time frame although in medium to bigger size fields the results have been quite even. Low draws have dominated in 8 and 9 runner races, but as I have said before it is generally not smart be too dogmatic about results when looking at very small samples.

Let us look at the individual draw figures for 2015 to 2019 (33 races):

Horses drawn 3 have done well, but although very low draws have had an edge, when looking closely at this table I am starting to think that the bias has not been as strong in recent years. My main reservation is that the place percentages for draws 1 to 7 are relatively similar and also the A/E values for draws 7 to 10 are higher as a group than draws 1 to 4, suggesting that any value that might exist is in that counter-intuitive area of the stalls.

The great thing about statistical research is that different individuals will interpret the data in different ways. This is simply my view: I could be wrong and once again it needs to be said that 33 races is still a very small data sample in which to have any real confidence.

Onto to 7f handicap running styles now. Here are the overall stats going back to 2009:

Front runners have had a fair edge with hold up horses again at a disadvantage. However, the bias is not as strong over 5 and 6f, with later runners having greater opportunity to get into a challenging position.

We actually have a reverse pattern to 6f in terms of field size. Over 7f front runners have had a huge edge in smaller fields: in races of 8 to 10 runners, (43 races in total) they have secured an impressive strike rate of over 28% with a huge A/E value of 2.24. I cannot explain why - perhaps it is because they are better able to stack the field up in behind and control the race - but the strike rates and A/E values do correlate strongly.

Finally let us examine the draw / pace (running style) combinations for front runners in 7f handicaps:

Low draws are once again more likely to lead as they are closest to the inside rail and thus have the least distance to travel. High drawn runners manage to get to the early lead in just one race in six on average. In terms of early leaders that have gone onto win the race, lower drawn front runners win more often (24.4%) than middle drawn ones (17.2%) who in turn go on to win more than high drawn front runners (13.3%).

It is also worth noting that hold up horses drawn low have won just once in 58 runs.

Combining the 5 to 7f data

Before I finish I wanted to combine all the data for the 5 to 7f distances at Chester (2009-2019). Firstly the draw splits:

Over half all of races in the full eleven-year study period were won by the bottom third of the draw; middle drawn runners have been roughly twice as successful when comparing them to higher draws.

Now the individual draw by draw data:

This table neatly demonstrates that despite the very well known low draw bias the very lowest draws continue to offer some value. Both draws 1 and 2 have made a blind profit to SP and both have A/E values in excess of 1.00, from a strike rate of almost 19%. The table also illustrates neatly that in general the higher the draw the lower the chance of winning: stalls 11+ have a collective win record of just six from 215 (2.8%).

The table below shows the combined pace data for 8+ runner 5 to 7f handicaps:

Looking at these figures, why on earth would you not try and get to the front at Chester over distances of 7f or less? Jockeys who hold up their mounts here by choice are either not trying to win or they don't know how to!

I hope this article has given you plenty of positive angles from which hopefully we can profit sooner rather than later.

- DR

Dave Renham: York Draw & Pace

In my most recent article I combined my draw bias roots with a more recently acquired interest in pace / running styles to overview their collective impact at Pontefract, writes Dave Renham. This time I am going to look at another northern racecourse, York.

A picturesque Grade 1 track, York stands in the south west of the city on the Knavesmire. The racecourse is around two miles in length in the shape of what resembles a 'U', and it has a long run-in of nearly five furlongs. Over the sprint distances of five and six furlongs they race on a straight course; the seven-furlong distance starts from a ‘spur’ or chute and they do race around the tangent of the home bend; from a mile upwards they race on the round course. The 1m 6f distance starts with a two-furlong chute at the end of the back straight before they join the main course.

York has always been considered to be a fair track and when I was studying draw bias ‘24/7’ back in the late 1990's and early 2000's the mile trip offered a decent low bias but, other than that, there was little to report. The sprint trips in those days looked very even with little difference from wing to wing. However, I have noticed more recently that a sprint draw bias may have started to appear so I am hoping the stats back that perception up.

York Racecourse map

For this article, as with the Pontefract one, I am using tools available on this site, namely the Draw Analyser, Pace Analyser and the Query Tool. The initial period of study is a long one, going back to 2009, but I will examine more recent data (2015 to 2019) in detail, too, where appropriate. I will also check other variables including ground conditions and will focus once again on eight-plus runner handicaps only.

From a draw perspective, when analysing each handicap race, I divide the draw into three sections (low, middle, high). This how the Geegeez Draw Analyser does it and has always been my favoured method, too. In this way, a ten-runner race has three low stalls, four middle stalls and three high stalls; an eleven-runner race has four low, three middle and four high; twelve-runner races have four low, four middle, four high; and so on.

It should also be noted that I also adjust the draw positions when there are non-runners. For example, if the horse drawn 6 is a non-runner, then the horse drawn 7 becomes drawn 6, draw 8 becomes 7, and so on.

The differences in the percentages will help to determine the strength of the bias and, given a level playing field, one would expect the win percentages to be around 33% for each third. The more races in a sample the better: that may sound obvious, but with any data set, especially the type of small ones in which racing must habitually deal, there is an element of randomness.

Finally, in terms of framing what follows, I will reference A/E and IV stats throughout. More information on these can be found here.

Right, let’s crack on with the 5f data.

York 5 furlongs (8+ runner handicaps)

Since 2009, the period under review, there have been 105 qualifying eight-plus runner five-furlong handicap races. I have also included races over 5 1/2 furlongs of which there of which there were 21. Here are the overall draw splits: 

These figures suggest a modest low draw bias over the longer term. The A/E values below back up this theory from a betting perspective:

For the record, if you had bet every horse from the bottom third of the draw at £1 per bet you would have roughly broken even – a loss to SP of 50 pence over 523 bets to be precise! [And, though it's not the main measure in this article, blindly backing those in the bottom quarter of the draw would have netted a £55.50 profit at SP!

Time to look at each individual draw position broken down:

Draws 2, 4 and 5 have made a profit to SP and all have A/E values above 1.00 again indicating a low draw edge. It is time to look at some more recent data; for this I will focus on the last five seasons (2015-2019). Here are the win percentages for each third over this more recent time span:

It is clear from these percentages that the low draw bias has strengthened in the last five years. These are the individual stall values:

Once again draws 2, 4 and 5 have proved to be profitable and if we combine the results of draws 1 to 5 they produce a positive overall A/E value of 1.09; compare this to draws 12 and above that combine for an A/E value of only 0.43. Low draws definitely have been in the ascendancy since 2015, although it should be said that the microcosm of 2019 was more even in terms of the draw.

It is unclear, having dug deeper, whether the going has any great significance. I cannot find a strong enough pattern to elaborate on and I don’t wish to further extend the article with relatively worthless stats as it is quite comprehensive as it is. Likewise the bias is consistent in terms of field size – low draws have had a similar edge in smaller fields of 8 to 10 as they have in bigger fields stretching across the track of, say, 17 runners or more.

Let us now look at pace and running styles. Here are the overall figures (2009-19) by early run style:

There is a clear edge for front runners here, a pace bias that seems marginally stronger on ground conditions of good or firmer. Looking only at big field (16+ runners) 5f handicaps, the IVs suggest a decent strengthening of the front running bias and a commensurately tougher time for hold up horses:


Now a look at draw / pace (running style) combinations for front runners in these 5f races:

For a straight course to see a single third of the draw (low) with an early leader figure of over 50% is unusual. Only Sandown over the straight 5f sees similar stats – the average % for all straight courses for low drawn runners taking the early lead is around 36%.

This 'early leader' by course table illustrates the point. (Note that a race can have more than one 'leader' where two or more horses contest closely).

You would expect 5f races around run a bend to have high figures like this for the bottom third leading early, as lower drawn runners should find it easier to get to the inside rail. But on the straight track at York, I cannot really explain the figures. Any suggestions welcome!

York 5f Handicaps (8+ runners) Summary

A low draw, ideally coupled with good early pace, or at least the ability to hold a position early, looks extremely important.

*

York 6 furlongs (8+ runner handicaps)

There have been 112 qualifying six-furlong races going back to 2009. Here are the overall draw splits: 

The ten-year picture shows a very even split which does not correlate with the 5f stats, both distances being run on the same straight piste.

The A/E values are what one would expect given the win percentages, with no-brainer profit angles conspicuous by their absence:


A look again at individual draw positions and how they have fared over this time frame:

This table is a good example of how random draw data can actually be, and how individual draw positions often show this randomness. Stall 3 is a complete outlier with 15 wins and a £93 profit; in the context of neighbouring stalls there is no other explanation than that it's the confluence of happenstance in a small data set.

Given the ostensible long-term fairness of the six-furlong trip in terms of draw thirds, I wanted to see if there might be a draw bias when studying more recent handicap data at the distance. Here are the draw splits for 2014-2019 seasons where have been 51 qualifying races:

Interestingly, the recent data points to a very strong-looking low draw bias, with high draws having really struggled. When we split by draw we see confirmation of that in less ‘random’ looking data:

Draws 2 to 5 have all been profitable to SP and all have very positive A/E values. This adds confidence in terms of there being a robust bias.

Let us now look at A/E values in a slightly different way – I am going to split the data by draws 1 to 5, then 6 to 10 and finally 11 or higher:


This really accentuates the low draw edge and I am fairly confident this is a bias we can exploit when the season gets started again. Before I move on to pace data, I want to share with you the result of the last qualifying handicap race, run on 12th October 2019.

It was the Coral Sprint Trophy with 22 runners; the first eight finishing positions were drawn as follows: 1st (5), 2nd (4), 3rd (10), 4th (3), 5th (2), 6th (1), 7th (8) and 8th (7). Seven of the first eight home were drawn in single figures and all were drawn in the bottom half of the draw. For record the last five horses’ home (placed 18th to 22nd) were drawn 22, 19, 14, 17 and 18 respectively.

This race demonstrates how strong the bias can be. Now, not all races fit this pattern, and high draws will have their ‘day’, more than once, but in recent years it is clear that lower drawn horses have enjoyed a significant edge.

As with the 5f races, I found that the going makes little or no difference to the above. Field size does have a small effect, however, with large fields (17+) increasing the low draw win percentage slightly to 59%. However, with only 22 races included it is a limited sample.

Now a look at York 6f handicap (8+ runners) pace and running styles now. Here are the overall figures going back to 2009:

There is a really significant edge for front runners, much stronger than over 5f which is unusual. Normally, as the distance increases, the edge for front runners decreases. This pace bias has actually been even stronger in the last five years – front runners have won around 30% of all races from 2015 with an IV of a whopping 4.06 and an A/E value of 2.92.

Now a look at draw / pace (running style) combinations for front runners in 6f handicaps (2009 – 2019):

These are virtually a carbon copy of the 5f figures. Once again lower drawn horses lead far more than you would expect. Again, this is difficult to explain and unfortunately I can’t.

York 6f Handicaps (8+ runners) Summary

Six-furlong handicaps at York in recent years have strongly favoured lower drawn runners from a draw perspective. In addition front runners seem to have a very strong edge, too, and horses appear far more likely to lead if drawn low (though I am struggling to find a reason for this).

*

York 7 furlongs (8+ runner handicaps) 

There have been 94 qualifying races over 7f. Remember this distance is run around part of the home bend starting from a chute: 

Middle draws have had the highest percentage of winners but the figures in reality are quite even especially when I share that lower draws have the best win and placed combined record. Ultimately this looks a very fair C & D in terms of the draw. I think some people may have expected lower draws to have a slight edge but I am not sure the initial chute plays they some might imagine.

The A/E values do suggest though that for win purposes middle draws have offered some value during this 11 year period:

The last five seasons have seen a similar pattern with a fairly even playing field; again, middle draws have arguably fared best, winning around 44% of all races.

Let us now look at each individual draw and their stats since 2009:

A few stalls have proved profitable, but it is highly unlikely this will be replicated in the future as there is no real pattern to it. It is interesting to note that the very highest draws (16 to 20) have provided just 1 winner from 121 runners. Hence in big field contests it looks best to avoid those with 'car park' berths.

In terms of going it seems that higher draws struggle when the going gets on the easy side. On good to softer or softer the draw splits are as follows:

The A/E values for those same good to soft or softer races correlate thus:

It should be stated that there have been only 28 races on this softer type of going, far too small a sample about which to be completely confident. However, the win and placed stats are also very poor for higher draws suggesting that it is certainly possible that this trend towards low to middle will continue.

York as a course rarely gets soft or heavy and only eight qualifying races have been run on that going in the last 11 years. However, worth sharing is that of the 28 win and placed horses, only three came from high draws (11 from low, 14 from middle).

From a draw perspective then a middle draw maybe optimal with both middle and low readily preferable to high: higher draws seem to struggle on going softer than good, and very high draws struggle all the time.

Onto to pace and running styles now. Here are the overall stats:

Front runners have a very slight edge but ultimately there seems no strong pace angle here over 7f. As the ground softens it seems that front runners and horses that track the pace start to have more of an edge but, as mentioned above, the limited sample of 28 races on good to soft or softer would temper confidence in the figures.

Finally let us examine the draw / pace (running style) combinations for front runners in 7f handicaps:

Low draws are more likely to lead as they are closest to the inside, and therefore have least distance to travel around the part-bend. However, whilst I alluded to the starting chute may help lower draws, it may also be that occasionally horses not well away from low draws get snatched up on the inside as wider-drawn rivals attempt to cut the dogleg.

We can see from this draw/run style heat map, which shows place percentage for 8+ runner 7f York handicaps, that those drawn low and held up have the poorest place rate of the waited-with participants.

York 7f Handicaps (8+ runners) Summary

To conclude 7f seems to offer draw and pace punters no significant edge, though exercising caution around high draws may be prudent.

*

York 1 mile (8+ runner handicaps) 

Onto the 1 mile trip – a distance at which I am hoping to see a relatively strong low draw bias as historically was the case during my 'draw fever' days. The configuration of the track, with a shortish run to two sharp left-hand bends in close proximity to each other. Horses trapped out wide can forfeit a lot of ground.

There have been 71 qualifying eight-plus runner mile handicaps going back to 2009: 


The raw stats clearly favour lower drawn horses. Middle draws are next best and, in turn, have an edge over higher drawn horses who look to be quite disadvantaged. In spite of this quite well known - and indeed obvious when one looks at the course configuration - advantage, the A/E values help back up the raw win percentages and imply a small profit to be had from backing low draws indiscriminately:

This increases confidence in the bias.

Looking at the going the bias is less strong on very fast ground (good to firm or firmer), but on good ground or softer low draws have prevailed in 27 of the 45 races (SR 60%).

So to the individual draw data now:

Looking at the lowest six draws as a whole they paint a relatively strong picture. Clearly not all six stalls were going to be profitable but you only have to look at wins, strike rate and A/E values to see these figures are strong in terms of their grouping. Combining all these stalls would have seen a small 3p in the £ loss backing all 426 runners ‘blind’, and their combined A/E value is an impressive 1.15. Compare this to draws 7 to 12 whose A/E value is just 0.35 and where backing all runners ‘blind’ would have lost you over 61p in the £.

Focusing on more recent data to see whether the bias has been as strong over the past five seasons (2015-2019) remains a smart ploy. There have been 34 qualifying races giving the following draw stats:

These stats mirror the 11 year data so the inside bias seems as strong as ever. Below is the constituent draw data for those last five seasons:

Again stalls 1 to 6 are the group of stalls that we are drawn to (pardon the pun!). Their combined A/E value stands at 1.20 and you would have made a small profit backing all runners drawn 1 to 6 to the tune of 7p in the £.

For real system punters out there backing horses drawn 1 to 6 that were also in the top six in the betting would have yielded 22 winners from 111 runners for a profit of £46.96 (ROI +42.3). Now I am not personally an advocate of systems but this illustrates how some punters could theoretically have made money over this track and trip in recent years. There is enough logic supporting the angle to suggest it has at least a fighting chance of continuing to pay its way.

The going stats noted earlier in the 11 year data are essentially the same with the more recent data subset. 59% of races on good or softer ground have been won by the bottom third of the draw (low).

A look at the pace / running style figures in mile handicaps (8+ runners) next:

A small edge for front runners and generally the closer to the pace you are the better. Front runners seem to enjoy a stronger edge as the ground gets firmer as the following table shows:

Data is limited which we must take into account of course; that is why I have added the placed stats too, which support the general direction of travel.

So onto the draw performance for front runners in mile handicaps:

Higher draws lead less often as one might expect, but I am surprised middle drawn horses have led slightly more often than lower draws. Perhaps some jockeys have the desire to overcome an ostensibly poor middle stall by gunning from the gate; if that is true, it would make it commensurately more difficult for the widest riders to execute the same strategy.

The Draw Analyser image below shows - for qualifying races run on good or firmer ground - first a draw table by IV3 (average Impact Value of a stall and its immediate neighbours), and secondly, a draw/run style heat map by Impact Value (IV). The benefit of a low draw and or pace pressing early position is clear, as is the difficulty faced by wider drawn runners, especially if held up.

York 1 Mile Handicaps (8+ runners) Summary

The mile trip shows a strong low draw bias and, from a punting perspective, it gives us a potential edge. This is underscored by very strong A/E values. The betting market has not taken the bias fully into account yet, and long may that continue!

*

York 1 mile 1 furlong (8+ runner handicaps) 

The final distance I wish to look at, but only briefly as there have been just 26 qualifying races in the last 11 years. With data so limited I am simply going to share the very basic stats. Here are the draw splits:

Low draws seem to have a very strong edge. My guess is that it would not be this strong with a much bigger sample of races, but as the distance is only a furlong more than the mile races we just reviewed, one would expect low draws to still comfortably hold sway. Here are the A/E values:


These correlate with the draw percentages as one might expect. For the record, stall 3 has provided ten of the 26 winners!

Pace wise, only two of the 26 races have been won by front runners with an A/E value of 0.93. Prominent racers have enjoyed the most success from the small data set and have won 13 races with an A/E of 1.55.

For the record, and mindful that there are just 26 races in this data set, here is the draw/pace heat map by place percentage:

York 1m1f Handicaps (8+ runners) Summary

I think it may make sense to group this distance with the 1 mile data in the future, but low draws and a prominent run style looks optimal, albeit from an unreasonably small sample of races.

*

York Draw / Pace Summary

In summary, York is a course where the draw clearly has a role: knowing where these biases potentially exist ought to help us with our battle to make  long-term profit.

Pace wise, the sprint distances of 5f and 6f appear to offer a solid front running edge, especially when combined with a low draw.

And at a mile and nine furlongs, the value of being draw away from the outside, ideally close to the inner, should not be understated.

Hopefully you have found this article useful; now it’s time to look at the next course!

- Dave

Punting Pointers: Pontefract Draw & Pace

The draw and potential draw biases is where my interest in horse racing began, writes Dave Renham. Back in the late 1990's I remember reading some excellent draw articles by Russell Clarke in a magazine called Odds On and I was hooked. Within days I was doing my own research using my Superform Annuals and pen and paper. This progressed to putting data into computers using excel.

I dread to think how much time I spent collating data. My main memory is working on my computer from 10pm to 2am on a regular basis. However, in those days the hard work was worth it because it was still a very under-researched area and draw biases were quite strong at certain courses. In addition to that, it was at a time before racing computer programs were commercially available.

It is over 20 years since I wrote my first book on draw bias and how things have changed since those ‘good old days’. At this juncture, it needs to be pointed out that many of the draw biases that were around 15 or 20 years ago are either not as strong as they were, or have disappeared completely. For many years draw biases provided punters with money spinning opportunities, me included. Virtually all my decent winning bets from around 1997 to 2006 were influenced by the draw in some way.

However, as with most things, when a good source of highlighting winners is found, within a few years the edge starts to disappear. This is very much a horse racing trait - good ideas gain an initial edge because the majority of people do not use that winner finding approach. As time goes on however, the betting public and the bookmakers catch up, and as a result the prices tend to contract and the value begins to disappear. This has happened with the draw, and to confound the problem course officials started using other means of negating potential draw bias. Running rails are now moved in order to keep horses off the fastest strip of ground, and better watering and drainage systems mean that most straight courses are far more even than they were back then.

The draw has had massive exposure in the past, and with people realising the edge is disappearing, the subject is beginning to assume less importance. However, before we begin to write off the draw completely, I still believe there is an edge for the educated draw punter. I maintain that at certain tracks a poor draw can still all but wipe out the chance of a horse, while a good draw increases one’s chances considerably. The trick perhaps is to find biases that may be more subtle, or at least which most punters are less aware of.

During this period of racing inactivity I plan to look at a few individual courses in depth, focusing primarily on draw bias but looking at pace aspects as well. The first course that will be put under the microscope is Pontefract.


Pontefract is located in West Yorkshire and is a left-handed track that is undulating with a stiff uphill finish in the home straight. Indeed the lowest point on the track is around the six-furlong start while the finishing post is the highest point, meaning both the five- and six-furlong sprints are testing.

The course is around two miles in length and, something I didn’t realise, is that originally it was around four furlongs shorter. Being left-handed one would assume that lower draws may have the advantage over high drawn horses at some distances, but the proof of the pudding, as always, will be in the eating!

For this article I am using key tools on Geegeez: namely the Draw Analyser, Pace Analyser and Query Tool. The period of study is a long one – going back to 2009, but I will examine more recent data in detail too.

My draw research has always focused on handicap races only. My belief is that handicap races give a better and fairer data set as such races are generally competitive affairs. When analysing each handicap race, I divide the draw into thirds - those drawn in the bottom third (low), those drawn in the middle third, and those drawn in the top third.

It should also be noted that I also adjust the draw positions when there are non runners – for example if the horse drawn 3 is a non runner, then the horse drawn 4 becomes drawn 3, draw 5 becomes 4 and so on. On a completely fair course the winning percentages for each "third" of the draw should be around 33% each. The differences in the percentages will help to determine the strength of the bias. The good news is that the Draw Analyser on Geegeez makes exactly the same splits, and is also capable of calculating draw by the advertised stall in your racecard and the actual stall, accounting for non-runners.

In my experience, I consider there to be two types of draw bias. Firstly, clear bias towards one specific section of the draw; this is the strongest possible bias. Secondly, one can get a bias against one specific section of the draw.

Another key factor to take into account is field size: for potential draw bias to exist I maintain there needs to be a reasonable number of runners in the race, and eight or more runners is the figure I have chosen. Draw bias is far more likely to be prevalent in larger fields as horses will either be forced to run wide (hence having further to travel), or be forced to run on a part of the track where the ground may be slightly slower. If the data set is big enough I will look at bigger field data where I feel it is appropriate.

OK time to crunch some numbers.


Pontefract 5 furlongs (8+ runner handicaps)

There have been 89 qualifying races - five-furlong handicaps with eight or more runners - during the period of study. Here are the overall draw splits:

Despite the track being left handed and the 5f distance having a bend to run round, low drawn horses do not dominate. The A/E values below suggest that the low drawn horses are overbet and are essentially poor value:

For the record, if you had bet every horse from the bottom third of the draw at £1 per bet you would have lost £136.34; backing all middle draws would have lost just £9.62 at starting price.

In the following table individual draw positions have been broken down for 5f 8+ runner handicaps at Ponte:

A few individual stalls made a profit but clearly there is no pattern to this so I would not be advocating backing certain draws in the future.

Field size seems to make no difference in the draw figures, but I was keen to look at whether the going made a difference. Back in the late 1990s and early 2000s when the going got testing in sprint races at Pontefract, horses tended to head towards the near rail in the straight giving higher draws an edge. Unfortunately for the minimum distance we only have 15 handicap races that have occurred on soft or heavy going; but, interestingly, lower draws have won 9 of the 15 (66.66%). That's far too small a sample from which to make any concrete conclusions; however, the 6f stats may give us more data to work with and may hopefully will show correlation.

Regarding 5f soft or heavy ground runners, you would make a very small profit backing lower drawn horses each way (£3.03 to £1 level stakes).

Let us look at pace and running style now. Here are the overall figures:

An notable edge for front runners can be observed. Moreover, better than 52% of horses that took the early lead went on to finish in the first three. This implies a strong front running bias.

On good ground or firmer the front running bias gets even stronger – early leaders win 20.48% of these races with an IV of 2.15. On good to soft or softer, conversely, front runners have failed to win any of the 22 races. It will be interesting to see if a similar pattern emerges over 6f.

Lastly for the five-furlong range, a look at draw / pace (running style) combinations for front runners in these 5f races:

Due to the left handed nature of the course/distance one might have expected more leaders to have come from the lowest draws. Interestingly, though, those horses that led from the bottom third of the draw (low) only managed to win three races from 39 attempts (SR 7.69%); A/E 0.51.

Horses that led early from middle draws went on to win over 25% of the time giving a positive A/E of 2.66. One additional stat is worth sharing: horses drawn in the bottom third of the draw (low) that were held up early have a dreadful record, winning just 2 races from 98 with an A/E of just 0.17.

Pontefract 5f Handicaps (8+ runners) Summary

The draw seems to be fair with no bias, while from a pace perspective front runners do have an edge.

Early pace is generally far more material than stall position.

Horses held up from a low draw have a terrible record.

*

Pontefract 6 furlongs (8+ runner handicaps)

 There have been 153 qualifying races over six furlongs during the period of study. Here are the overall draw splits:

There seems to be a small advantage for lower draws here. It may not be hugely significant but is worth further investigation. The A/E values correlate to a certain extent as shown below:

A look again at individual draw positions and how they have fared over time:

Stalls 1 to 3 have decent individual A/E values and stall 2 has secured a long term profit. However, backing this draw blind in the future looks a less than robust way to produce a profit. I would be encouraged, however, if a horse I fancied was drawn in the bottom three stalls – this would be an extra tick in the box as it were.

This graph, which shows IV3 (the average Impact Value of a stall and its closest neighbours, e.g. 456), helps to visualise the table above from a 'likelihood of winning' perspective:

Looking at field size, low draws have the strongest edge in smaller fields (races of 8 or 9 runners). There have been a decent number of these races – 62 in total. The draw split for winners as follows:

The A/E value for low drawn horses edges up to 1.06 here. It seems therefore that a lower draw is more preferable in smaller fields. It is nothing to go ‘crazy’ about but a lower draw under these circumstances does look preferable.

What about the impact of the going in Ponte handicaps over six furlongs? It was noted above that, on soft or heavy ground in 5f handicaps, low draws seemed to have an edge albeit from limited data. In handicaps over a furlong further, the soft or heavy draw stats look as follows:

Again this data set is quite small (21 races), but a look at the win and placed data - table below - strongly suggests a lower draw is preferable:

For the record, backing all low-drawn horses EACH WAY on soft or heavy ground would have secured a profit of £19.57 to £1 level stakes.

Next follows a table illustrating the effect of pace and running style:

An edge for front runners again, while hold up horses have a relatively moderate record. When looking at 5f races earlier it was noted that front runners did better on firmer going and had struggled in testing ground. Unfortunately, from a statistical point of view at least, the complete reverse is the case here with front runners having performed far better on testing ground: indeed from the limited sample they have won over three times more than would be expected statistically. So one potential theory goes out of the window!

Again, we'll close out the distance review with a look at draw / pace (running style) combinations specifically for front runners in 6f handicaps:

As with the 5f range, horses which are drawn high are less likely to get to the early lead - in this case approximately half as likely as those drawn middle or low. There is little to choose between low and middle drawn horses in terms of getting to the early lead.

However, it should be noted that higher drawn horses that got to the lead have managed to go on to win almost 20% of the time.

Pontefract 6f Handicaps (8+ runners) Summary

To conclude, the 6f trip seems to offer low drawn horses an advantage which appears to increase in smaller fields.

The bias towards lower draws has been stronger on softer ground where, conversely, higher draws have struggled more.

 *

Pontefract 1 mile (8+ runner handicaps)

Most people focus their draw attentions at sprint distances, but a mile for me has always been the key distance at Pontefract in terms of the draw. From my previous research, lower draws traditionally had a decent edge over a mile so let’s look at the current data. There have been 142 qualifying races which gives us a really good chunk of information:

As expected the low draw bias is strong, with the A/E values not surprisingly following a similar pattern:

And here is the performance of each individual draw since 2009:

Draw 2, as it did over 5f and 6f, shows a blind profit. The A/E values for draws 1 to 3 are good as one would expect. This table does show quite neatly the draw bias in operation – several columns show this such as the win% column, the ew % column and the A/E column.

Once more, the IV3 chart brings the point home:

As this mile trip indicates a strong bias it is worthwhile checking a more recent subset of the data to confirm the long-term perspective. Focusing on the last four seasons (2016 to 2019), during which time span there were 54 races, gives the following splits:

These are similar results albeit a slightly lower win percentage for the bottom third of the draw. However, it ratifies the bias which has been around for years remains alive and kicking.

A  solid footnote is that in the past four seasons 23 of the 54 mile handicap races with eight or more runners were won by horses drawn 1 or 2 (SR 42.6%). Compare this with just eight wins achieved by the two highest drawn horses.

In addition, for those who like ‘exotic’ bets, you would have made a small profit if you had permed the lowest two drawn horses in every race in £1 reverse exactas: £14 profit from a £108 outlay. Of course an exacta is a pool bet so it is difficult to exploit potential draw biases in this way as such ideas, if overbet, would contract the returns. Having said that I have personally had much success in the past perming certain draws at certain tracks.

Back to the complete data set (going back to 2009) and a look at mile handicaps by number of runners - specifically looking at fields of 8 or 9 runners - there have been 53 races with the following draw splits:

A stronger bias it seems for lower drawn horses in small fields. The A/E values back this up as is shown below:

There also is a strengthening of the bias in bigger fields albeit from a relatively small sample. In races of 14 runners or more, 19 of the 30 races (SR 63.3%) have been won by the bottom (low) third of the draw.

Turning attention to the state of the turf, the win percentages for low drawn runners are extremely uniform and I have found nothing of note there.

However, with regard to pace and running styles, there are some factors to keep in mind. Here are the overall stats:

In racing in general, as the race distance increase so front running biases start to diminish. However, at Pontefract there is a stronger front running bias over a mile than at 6 furlongs. I found nothing of interest when delving into going considerations and field size, so nothing extra to report there.

Finally over this mile trip this is how the draw / pace (running style) combinations look for front runners in 1 mile handicaps:

These stats demonstrate that it is much easier - or at least more common - for a horse to lead from a low draw over a mile at Pontefract. Having said that, high drawn early leaders have gone on to win slightly more often in percentage terms. Horses that race mid division or are held up when drawn in the top third of the draw (high) have won just 7 races from 285 runners.

Geegeez Draw Analyser has a heat map to help visualise this, here displaying IV:

Pontefract 1 Mile Handicaps (8+ runners) Summary

The mile trip at Pontefract shows a significant draw bias to lower drawn horses. It is one of the strongest mile biases in the UK, if not the strongest.

From a pace angle, it is preferable for a horse to lead or track the pace.

*

Pontefract 1 mile 2 furlongs (8+ runner handicaps)

The final distance to be examined in this article is a mile and a quarter. The configuration of the track means that there is an extra bend at this distance as compared to the mile trip and hence one would expect low draws to again have a decent edge. There have been 107 qualifying races from which to find angles:

On first view this looks a very strong bias with lower draws dominating and higher draws seemingly at even more of a disadvantage than they were at a mile. The A/E values back up the raw win percentages as a measure of profitability:

Indeed backing every horse drawn in the lowest third over ten furlongs at Pontefract (8+ runner handicaps) would have returned £39.90 to a £1 level stake.

Individual draw data next, and can stall 2 make a blind profit yet again??!!

Yes! Stall 2 has made a blind profit again - meaning it has been profitable at every individual distance up to 1m2f - as have stalls 3 and 4. Again, this table helps one visualise the strength of the low draw bias. Would I consider backing draws 1 to 4 ‘blind’ in the future? No, but it is clear that these draws must be the primary focus when analysing these races. Here is the IV3 chart to bring that home:

Time to check out more recent data to see whether the bias has been as strong over the past four seasons (2016-2019). There have been 33 qualifying races during that time, giving these stats:

Whilst it is not quite as strong, that could simply be down to the smaller - less reliable - sample size. It still indicates that low draws have a substantial advantage over higher ones.

Moving back to the complete data set (2009-2019) the low draw bias seems to strengthen considerably as the field size grows. This makes sense as the extra bend potentially helps lower drawn runners and impedes higher drawn runners who have to race wider. In races of 12 runners or more, 20 of the 31 races (SR 64.52%) have been won by the bottom third of the draw (low). The A/E value stands at a very healthy 1.25.

Indeed moving the goalposts up further - to 13+ runners - low draws have totally dominated, winning a huge 17 of the 22 races (SR 77.27%). The A/E value for low drawn runners is an uber-impressive 1.53.

Looking at going data there is something which stands out albeit from a limited sample. Races on soft or heavy seems to increase the strength of the low draw bias. From 21 races 15 were won by a horse in the lowest drawn third of the field. That equates to over 70% and an A/E of 1.55. Of course with limited data one cannot be too dogmatic, but these figures are still highly promising.

A look at the pace / running styles figures next:

Front runners have a stronger edge than I had expected, winning twice as often as most other run styles: maybe that extra bend near the start helps.

And finally, the draw / pace (running style) combinations for front runners in 1m2f handicaps:

Lower drawn horses as expected lead more often and roughly four in seven of them go on to finish in the first three. High drawn horses tend to struggle when racing mid division or when held up. This was also the case over 1 mile as we saw; over 1m2f such runners have won only five races from 207 runners.


Pontefract 1m2f Handicaps (8+ runners) Summary

The 1 mile 2 furlong distance shows a similarly strong low draw bias to that at a mile, and it seems that bigger fields may accentuate this.

Soft or heavy going may also strengthen the bias but that notion is based on limited data and so a watching brief is recommended.

*

Fingers crossed, in the near future we will see race meetings start again at Pontefract and, when they do, I hope these stats will help point you in the right direction in the ‘fight’ against the bookmakers.

- DR

Dave Renham: A synopsis of 6f and 7f AW Draw/Pace

In my last article I examined draw and running style combinations in five-furlong handicaps on the all-weather, with the main focus on front runners (those horses that take the early lead).

That article showed that on turning AW courses over the minimum trip (8+ runners), it was much easier to lead early from a lower draw compared to a higher one. That much is simple geometry: horses drawn low are closest to the rail and hence have less distance to travel to the first corner than their wider-drawn counterparts. It is worth noting that the positioning of the first bend can make a difference, as can the tightness of the turn.

However, the most surprising finding from the first article was that higher drawn horses that take the early lead actually go on to win more often than early leaders drawn low. I still cannot quite get my head round why this may be the case. As stated in that previous piece, I have always assumed that it is likely to have been quite an effort to pass so many horses to get to the lead from a wide draw. In addition to this, these runners probably would have had to run slightly further to achieve this.

Since writing the article I have tried to come up with a logical explanation for why higher-drawn horses have been able to win more often when leading early. Perhaps once these wide drawn runners get to the lead, the jockey on board tries to slow the pace down slightly in order to give his horse a breather, knowing that it would expended more energy than is ideal over that first half furlong or so.

More likely, though, is the impact of physics. As can be seen from the crude mock up below, a horse drawn inside has the best chance to get to the turn in front because it has the least distance to travel; but, once it gets to the turn the horse may need to decelerate in order to navigate around. Conversely, although a wider drawn runner has less chance to reach the turn in front - due to the potential of other horses inside to show early speed - on the occasions that a wide-drawn horse faces no pace contention, that horse can negotiate more of the turn at greater speed due to the angle at which it approaches the bend.

This of course depends on the location of the bend in relation to the start of the race. There is also a rule about jockeys staying in lanes for 100 yards, which might be described as 'loosely observed'. Regardless, hopefully it is clear how the less frequent wide drawn leader might win more often.

The impact of stall position on speed into the first turn

The impact of stall position on speed into the first turn


This is simply conjecture but in certain cases this could be what is happening. It might another day be worth looking at the new sectional timing data on Geegeez and matching it to those races where wide drawn runners had led early and gone onto win.

In this article I am going to look at six- and seven-furlong handicaps to see if similar patterns emerge in terms of draw / front runner combinations. Newcastle will be ignored as these distances are raced on a straight track there, but I will include Southwell this time as the six and seven furlong trips are raced around a bend there. Thus, we have six courses to look at: Chelmsford, Dundalk, Kempton, Lingfield, Southwell and Wolverhampton.

All-weather 6f handicaps (8 + runners)

Let's start by looking at draw / front runner combinations over six furlongs in handicaps. I only ever use handicap races for this type of research as non-handicap data is far less reliable. As mentioned in the first piece, the draw is split equally in three – low, middle and high - and hence one would expect, given a level playing field, that the ‘led early’ percentages would hit around 33.3% respectively from each section.

[wpdatatable id=9]

For five of the six courses we see that once again the early leader is more likely to come from the lowest third of the draw – those drawn closest to the inside rail. Only Wolverhampton bucks the trend and this is probably because the first bend is more than a quarter mile from the start. That presents less of a positional advantage to the inside stalls and, essentially, the quickest horse from the gates should lead regardless of draw position. Dundalk seems to favour lower drawn horses the most with the bottom third of the draw producing more than half of all early leaders under these conditions.

The following table is another way of illustrating how much more likely low drawn horses are to lead than high drawn ones – I used this approach in the previous article and have replicated it for this range. It has been calculated by dividing the "low draw led%" by the "high draw led%".

[wpdatatable id=10]

Compared to the five furlong data these figures are not as high, but nevertheless if you are keen to predict the front runner, which we know is potentially a profitable angle, then horses from lower stalls do lead early significantly more often than higher drawn ones.

If we take Wolverhampton out of the equation and focus on the other five courses at six furlongs, when we increase to 12 or more runners the front running bias to lower draws does increase:

[wpdatatable id=11]

Under these circumstances the lowest third of draw is around 2.3 times more likely to produce the early leader of the race. This stronger bias mirrors the data we saw when analysing five-furlong handicaps. With higher draws starting further away from the inside rail in bigger fields, it is even harder for such horses to get to the early lead.

For the record here are the figures for Wolverhampton, where there have been over 300 qualifying races:

[wpdatatable id=12]

A very even split – with that long run to the first bend it seems that bigger fields do not make it more difficult for high drawn horses to lead early.

Moving on, let us now look at win percentages for the early leaders from each third of the draw at the six courses. Here is the six-furlong handicap data for eight or more runners:

[wpdatatable id=13]

I mentioned at the beginning of this article that in five-furlong handicaps (at Chelmsford, Dundalk, Kempton, Lingfield and Wolverhampton), wider/higher drawn horses that take the early lead rather surprisingly go onto win more often than horses leading early from low draws. Over this extra furlong we can see that the courses give us a more even profile in terms of eventual win percentage. Having said that higher drawn horses that lead early still win on average slightly more often than lower drawn leaders. At Lingfield and Southwell, for example, higher drawn horses that take the early lead go onto win roughly one race in every four.

This even looking playing field is replicated when we combine all the 12+ runner data. Merging all courses together we get these win percentages:

[wpdatatable id=14]

As I have already alluded to, before researching and writing the five-furlong article I had expected that five- to seven-furlong races run around a bend would give horses that led early from a low draw much more chance of winning than those from a high draw. I had expected this bias against higher drawn horses to get even stronger the further the horses had to travel. It seems that for this theory I was right at least – it is harder over six furlongs than five furlongs for higher drawn early leaders to win. However, I had not expected higher drawn horses to still be more successful, in 8+ runner races at least, than lower drawn ones.


All weather 7f handicaps (8 + runners)

Now let's look at draw / front runner combinations in seven-furlong all-weather handicaps:

[wpdatatable id=15]

All six courses this time show that the early leader is more likely to come from the lowest third of the draw. Dundalk once again provides the strongest bias, while at Southwell and Wolverhampton it is significant too. To perhaps illustrate this more clearly I have once again created a table showing the figure that is calculated by taking the low draw led% and dividing it by the high draw led%:

[wpdatatable id=16]

Interestingly it seems that in general lower drawn horses find it easier to lead over seven furlongs than at six. Again, on some tracks, notably Wolverhampton where the seven furlong start is in a chute on the brow of a bend, geometry plays its part.

Increasing field size to twelve or more runners enhances the front-running bias of lower drawn horses (as it does, too, over five- and six-furlongs).

[wpdatatable id=17]

Once again bigger fields give lower drawn horses a better chance of leading early.

The below shows the win percentage of early leaders from each third of the draw at the six courses over seven furlongs (8+ runner handicaps).

[wpdatatable id=18]

This is quite an even set of figures when looking at the courses as a whole. Nevertheless, we still see that higher drawn horses which lead early are not at any real disadvantage. Those general themes are still true when we combine all the 12+ runner data from seven-furlong all-weather handicaps. Grouping the six turning courses we get these win percentages:

[wpdatatable id=19]


Summary

The above contains some interesting insights which may be combined with what we learned about five furlong handicaps on the all weather last time.

Like with races at the minimum, it may be easier to get to the lead from a lower draw over six and seven furlongs, but don’t be put off by a potential front runner drawn high. If your wide-drawn horse does lead, it has just as much chance of going onto win as a front runner drawn low.

Although these are not quite the startling statistics from the five-furlong article, to my eyes some of the findings are still surprising.

Personally, I am still shaking my head not quite believing what I have discovered over the past two articles. I just wonder how many bets I have ignored over the years due to a potential front runner being drawn high. Far too many!

- DR

Dave Renham: A Synopsis of 5f AW Draw/Pace

I have discussed pace angles in numerous Geegeez articles – see this list – and once again I would like to revisit this key area, this time in conjunction with draw, writes Dave Renham.

I have noted before that if you were able to predict the front runner in certain types of races it would amount to a license to print money. For example, going back to 2011, if you managed to correctly predict the front runner in every all-weather UK 5f handicap race with 8 or more runners, you would have profited by over 60p for every £1 staked!

Indeed at Kempton Park the profit would have been £1.04 for every £1 staked. For the record, in 6f handicaps on the sand you would have also profited from front runners to the tune of 33p for every £1 staked, while in 7f handicaps you still would have made 17p per £1 staked.

Naturally, and unfortunately, predicting who will lead in all-weather sprint handicaps is not as easy as all that.

In the past I have looked at different ideas to help increase the chances of predicting the front runner. For example, looking for horses that had led LTO, or looking for horses that have the highest pace score average over the past four races. I have also studied going conditions, the effect of field size etc.

One area though that I have yet to look at in real depth is the position of horses in terms of the draw. For this piece I have collated some all-weather handicap stats from the draw analyser on Geegeez, which also contains draw / run style data.

The draw can have a significant effect at some courses in both a positive and negative way. Races where the first bend is close to the start should offer lower drawn horses some advantage as they are berthed closest to the inside. At the tight turning course of Chester for example, this low draw bias is well known and documented.

Just as there can be a potential draw bias due to being drawn closest to the inside rail, one would assume that these horses have a greater chance of leading early. This is simply due to the fact that they have less distance to travel to the rail at the first corner than horses drawn wider. Of course, not all horses will try to lead early, but I felt it was time to crunch the numbers as I believed the data would back up my theory.

For the record, I have included Irish course Dundalk along with the six UK all weather tracks.

All weather 5f handicaps (8 + runners)

Let us begin by looking at draw / run style combinations over 5f. The draw is split equally in three – low, middle and high - and hence one would expect, given a level playing field, that the ‘led early’ percentages would hit around 33.3% respectively from each section.

It should also be noted that 5 of the 7 course and distances are run round a bend with only Newcastle and Southwell run on a straight course. A look at Newcastle and Southwell first:

[wpdatatable id=1]

The Southwell figures are relatively even which is what I would have expected. However, the Newcastle stats are interesting with higher drawn horses far less likely to lead than those drawn low to middle. I cannot give a reason why this is the case, but it will be interesting to see if this pattern continues in the coming years.

Onto the other five courses and for the remainder of this article I will just focus on these as all distances are on a turning strip:


[wpdatatable id=2]


This table shows that at all five courses the early leader is more likely to come from the lowest third of the draw – those drawn closest to the inside rail. I am pleased the stats seem to back up my original theory. In addition, horses from the middle stalls lead more often than those drawn high, suggesting there is a correlation between draw position and likelihood of leading.

The following table gives another way of illustrating how much more likely low drawn horses are to lead than high drawn ones – this has been very simply calculated by dividing the low draw led% by the high draw led%:

[wpdatatable id=3]

This table illustrates the bias to lower drawn front runners quite neatly with four of the five featured tracks’ minimum distance handicaps seeing lower drawn horses more than twice as likely to lead early as higher drawn ones. Dundalk seems to have the strongest low drawn front running bias and it is also worth sharing that horses drawn 1 and 2 at the Irish venue have provided the early leader 31% of the time.

Combining the data for all round-course 5f handicaps on the all-weather, and increasing the field size to 12 or more runners, there is an even stronger bias to low draws leading early. There are over 170 qualifying races which is a decent enough sample:


[wpdatatable id=4]


Under these circumstances the lowest third of draw are around 3.5 times more likely to produce the early leader of the race. This stronger bias makes sense as higher draws start even further away from the inside rail in bigger fields.

Another assumption I wanted to validate was that when higher drawn horses lead early they are less likely to go onto win: the reasoning behind this is that I perceived it to have generally been quite an effort to pass so many horses to get to the lead from a wide draw, as well as the fact that such runners would probably have had to travel slightly further to achieve this. Combining these factors, it would be logical to deduce that the horse might tire late on due to its earlier exertions in getting to the lead.

However, the stats do not back this up. Below are the win percentages for early leaders from each third of the draw at the five round-course all-weather tracks, firstly focusing on 8+ runner handicap data:


[wpdatatable id=5]


Horses that lead from high draws at Chelmsford manage to go on to win three races in eight; those at Dundalk and Kempton prevail better than one in four. Only at Lingfield does it seem a negative to lead early from a high draw.

A similar pattern emerges when we look at the 12+ runner handicap data. Combining the courses we get these win percentages:


[wpdatatable id=6]


I concede these stats have really surprised me. However, in many respects this is good news if you like backing front runners. In the past I may have been put off by a potential front runner drawn wide as I would have assumed if they did manage to lead they were less likely to win. This is not the case –over 5 furlongs at these courses anyway!

Conclusions

This article has shown that in all-weather 5f handicaps contested on a round course, it is easier to lead from a lower draw than a higher one, BUT… in terms of winning the race you may prefer your potential front runner to be drawn high!

Food for thought I hope, and if you have enjoyed this piece you will perhaps be pleased to know that I plan to look at 6f handicaps in a follow-up article.

  • DR

p.s. if you want to understand the impact of draw and pace in combination, Geegeez Gold's new Heat Map underlay within the pace tab does just that, for the specific course/distance/field size/race type combination in question - example below. Click here to join Geegeez Gold >